ACM MM 2026 — Accepted (To Appear)

Seeing is Free, Speaking is Not

Uncovering the True Energy Bottleneck in Edge VLM Inference

Junfei Zhan1  ·  Haoxun Shen2  ·  Mingang Guo2  ·  Zixuan Huang3  ·  Tengjiao He4†

1Department of Computing, Imperial College London  ·  2Department of Electrical and Systems Engineering, University of Pennsylvania  ·  3Xiaohongshu Inc.  ·  4College of Information Science and Technology, Jinan University

The 34th ACM International Conference on Multimedia (ACM MM 2026)  ·  Corresponding author

The first systematic energy profiling of 5 VLMs on 2 edge platforms overturns a widespread assumption: the energy bottleneck is not visual processing, but text generation.

86–97%Energy from Decode
11–39×Output vs Input Cost
<5%Power Variation
5×2VLMs × Platforms

Scroll to explore ↓

Where does the energy go in edge VLM inference?

Vision-Language Models run on edge devices like Jetson Orin NX and laptop GPUs. Most efficiency work assumes visual token processing is the bottleneck. We measured where energy actually goes.

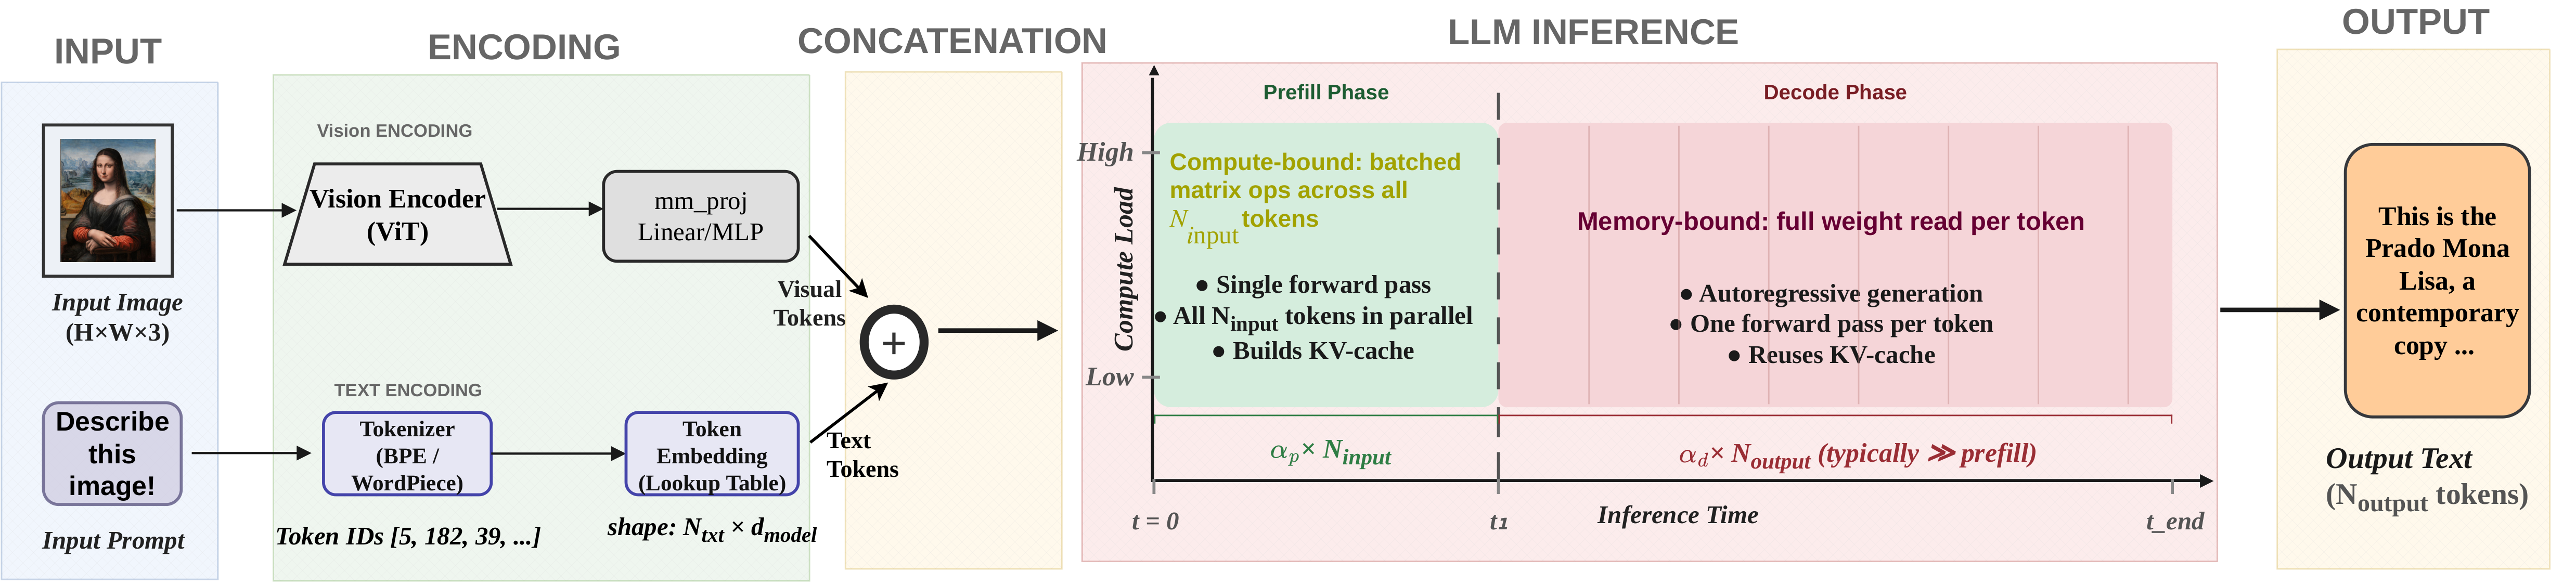
VLM inference pipeline
VLM inference pipeline. An image and prompt are encoded into visual + text tokens, then processed by the LLM in two phases: a fast parallel prefill and a slow sequential decode.

5 VLMs × 2 Edge Platforms × 1,680 Runs

We systematically profile energy across three architecture families, four input resolutions, and two hardware platforms.

Model Params Vision Encoder Token Strategy αdp
InternVL3-1B1BInternViTFixed (265)11×
InternVL3-2B2BInternViTFixed (265)17×
Qwen2-VL-2B2BQwen-ViTDynamic (73–1033)39×
Qwen2.5-VL-3B3BQwen-ViTDynamic (73–1033)12×
Gemma-3-4B4BSigLIPFixed (265)17×
Qwen2.5-VL-7B7BExtended validation — Table 5
InternVL3-8B8BExtended validation — Table 5
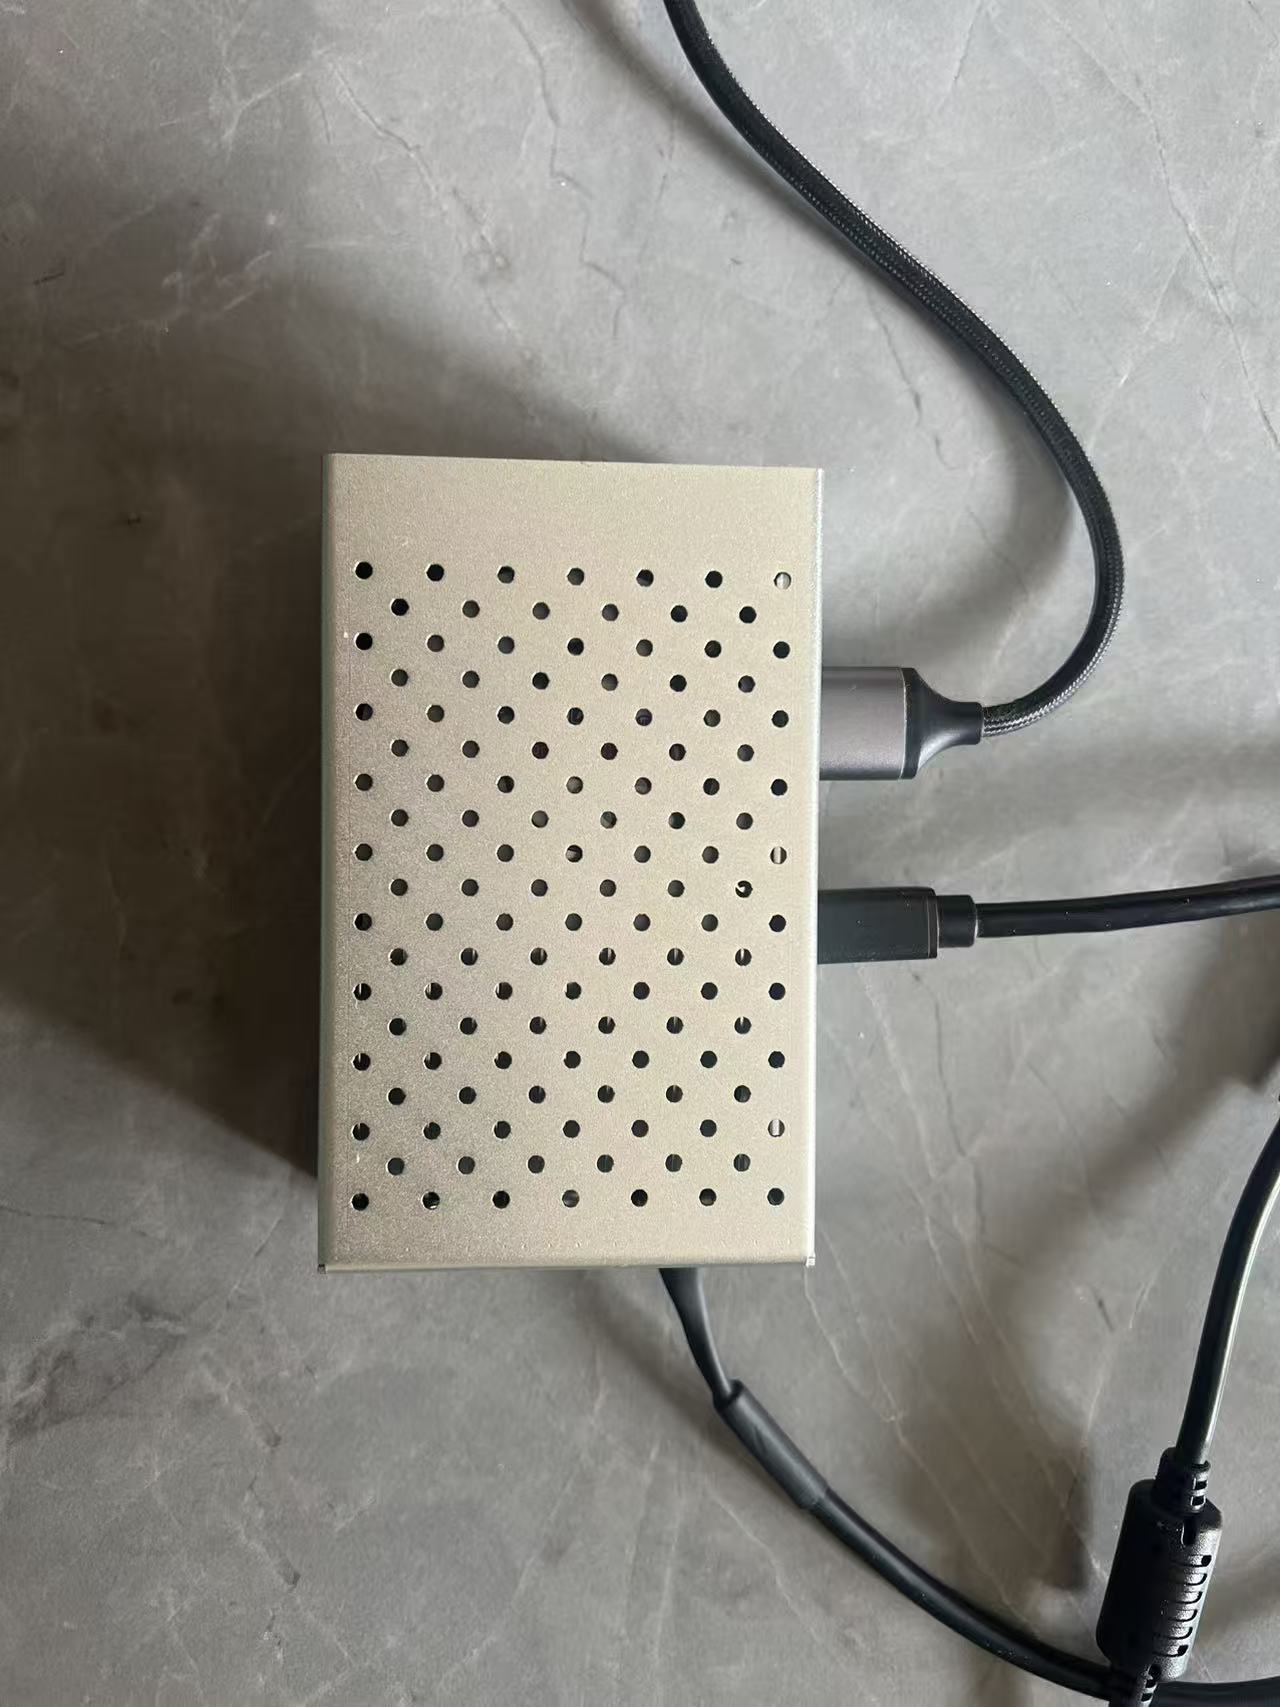
NVIDIA Jetson Orin NX 16GB with power measurement

NVIDIA Jetson Orin NX 16 GB

15W mode, jetson_clocks enabled. Power measured via on-board INA3221 sensor at 100ms intervals.

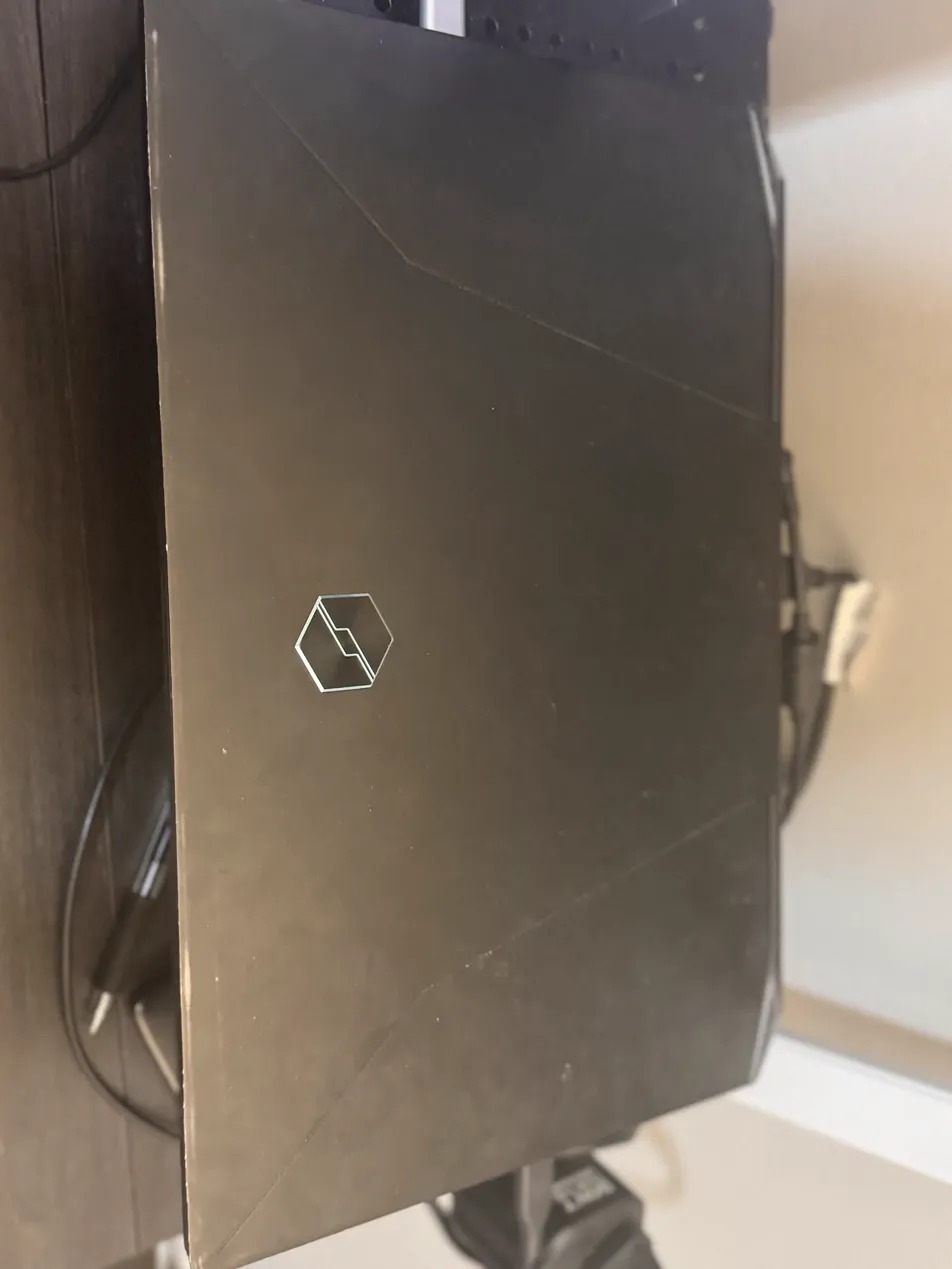
RTX 3070 Laptop GPU setup

NVIDIA RTX 3070 Laptop GPU

8 GB GDDR6, frequency locked at 1500 MHz. Power via NVIDIA SMI at 100ms polling.

Two phases of LLM inference

Click each phase to understand why their energy costs are fundamentally different.

PREFILL Processing all inputs

Seeing — Fast & Cheap

  • All Ninput tokens in one parallel forward pass
  • Compute-bound — GPU cores fully utilized
  • Builds KV-cache for decode phase
  • Only 3–14% of total energy
DECODE Generating output

Speaking — Slow & Expensive

  • One forward pass per token, sequentially
  • Memory-bound — reads full weights each step
  • Autoregressive: each token depends on all prior
  • Consumes 86–97% of total energy
Energy split Click a phase above
9%
91%

Decode dominates everything

Across 5 models and 2 hardware platforms, autoregressive decoding accounts for 86–97% of total energy. The bottleneck is how much the model says, not what it sees.

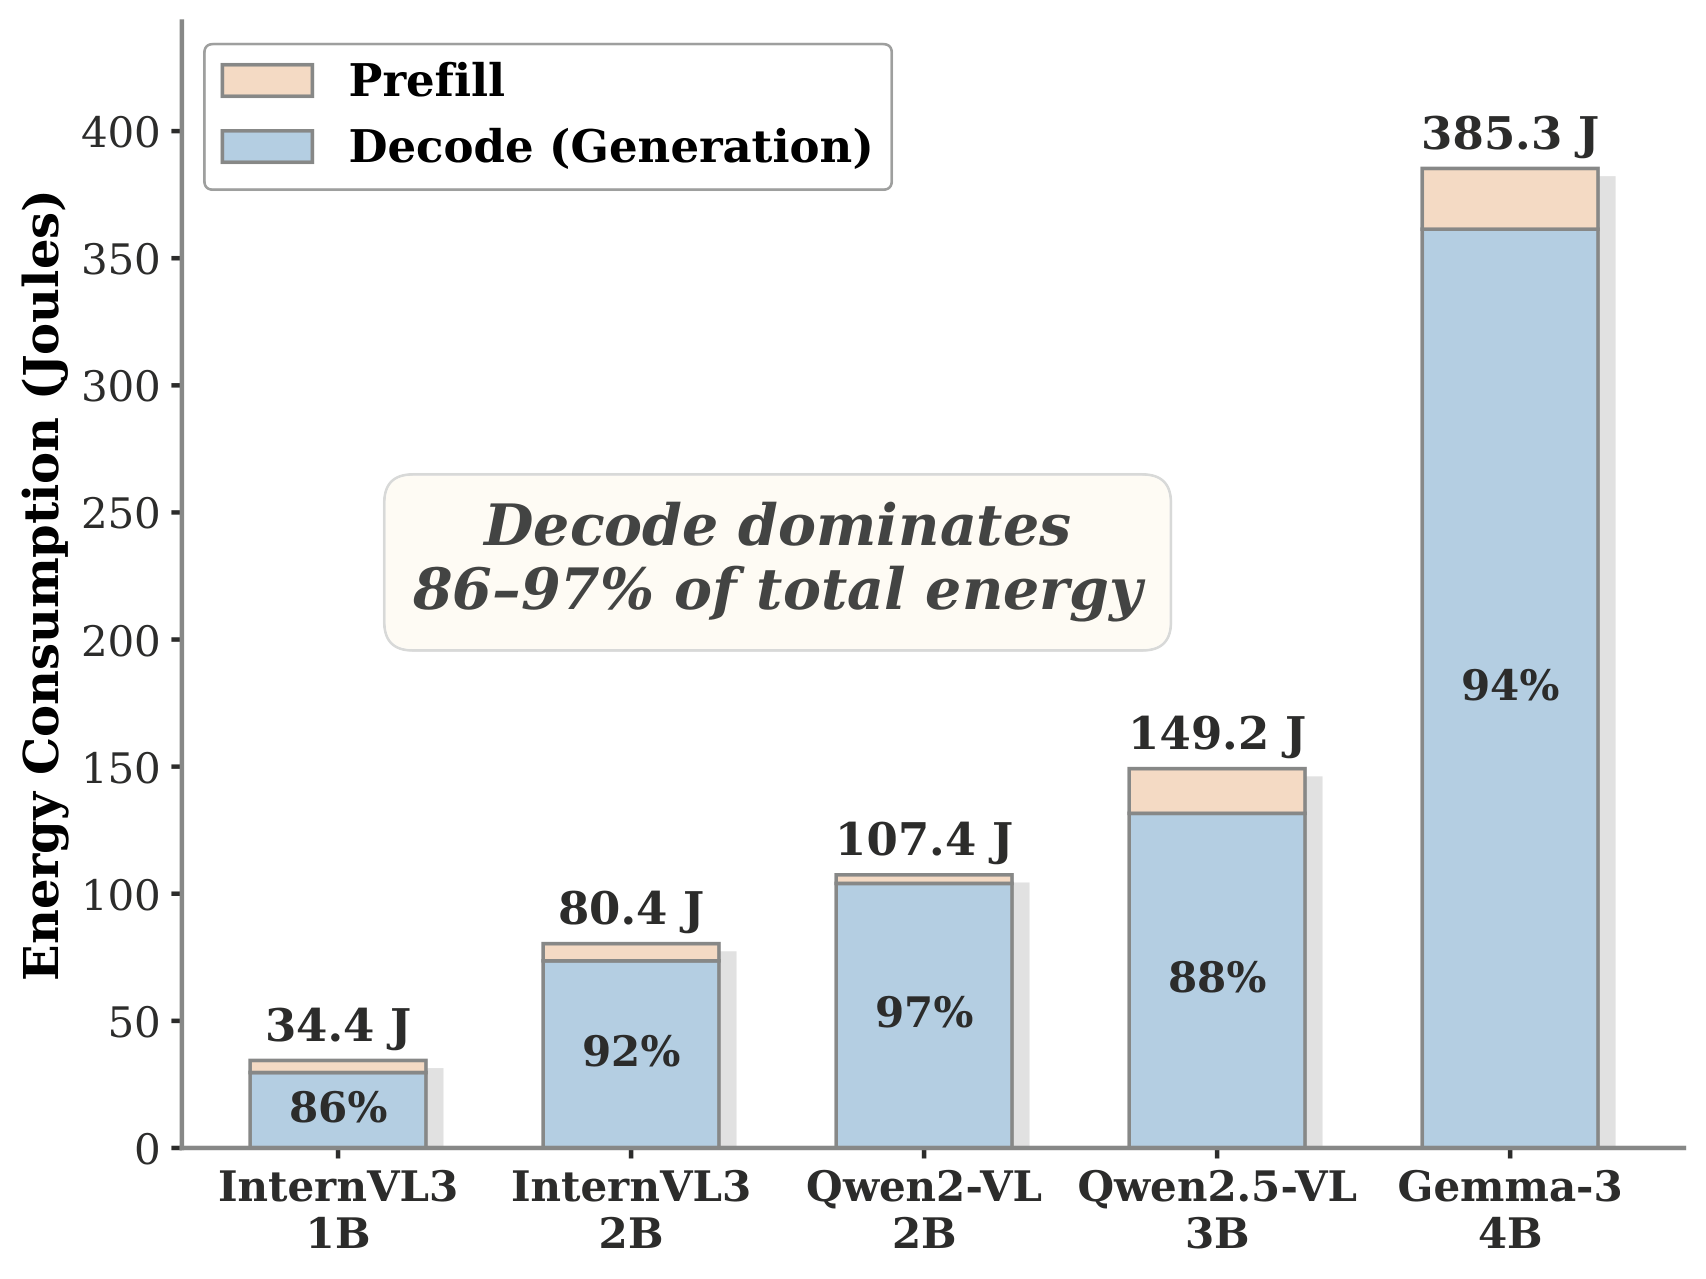
Energy decomposition: decode dominates 86-97% across all 5 VLMs

Decode consumes 86–97% of total energy

Stacked bars show prefill (orange, top) vs. decode (blue) energy for each model on RTX 3070. Even the smallest model spends 86% on decode.

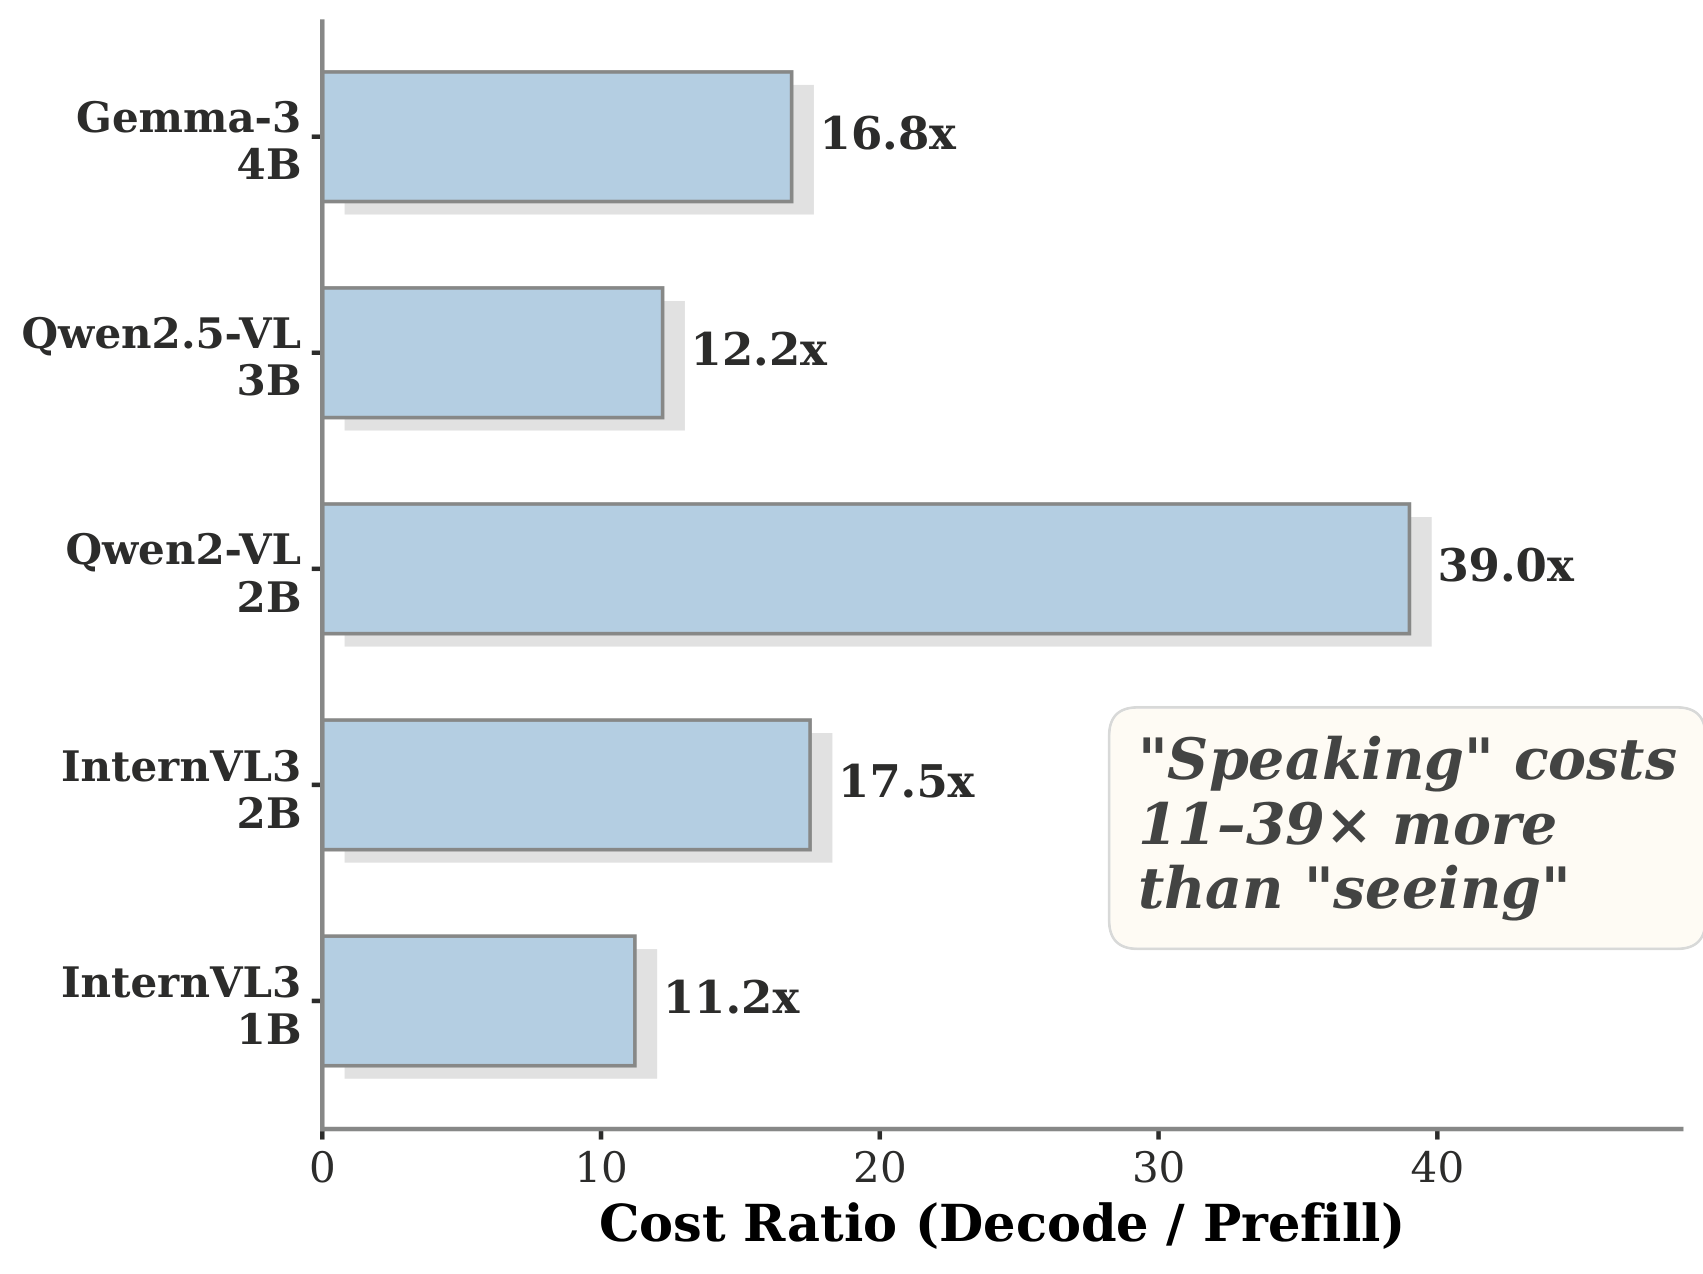
Cost ratio: each output token costs 11-39x more than input

"Speaking" costs 11–39× more than "seeing"

Per-token cost ratio (decode / prefill). Qwen2-VL-2B's dynamic tokens make it 39× more expensive to generate than to process input.

91%
Decode Energy
Decode (86–97%) Prefill (3–14%)

Why does decode cost so much?

Prefill is compute-bound: all tokens process in parallel in one forward pass. Fast and cheap.

Decode is memory-bound: one forward pass per token, reading full model weights each time. Slow and expensive.

Each output token costs 11–39× more energy than each input token. A single output token on InternVL3-2B costs as much as processing 17 visual tokens.

Three surprising findings

Our systematic profiling reveals counterintuitive truths about where energy goes—and where it doesn't.

Finding 1

Power is a model fingerprint

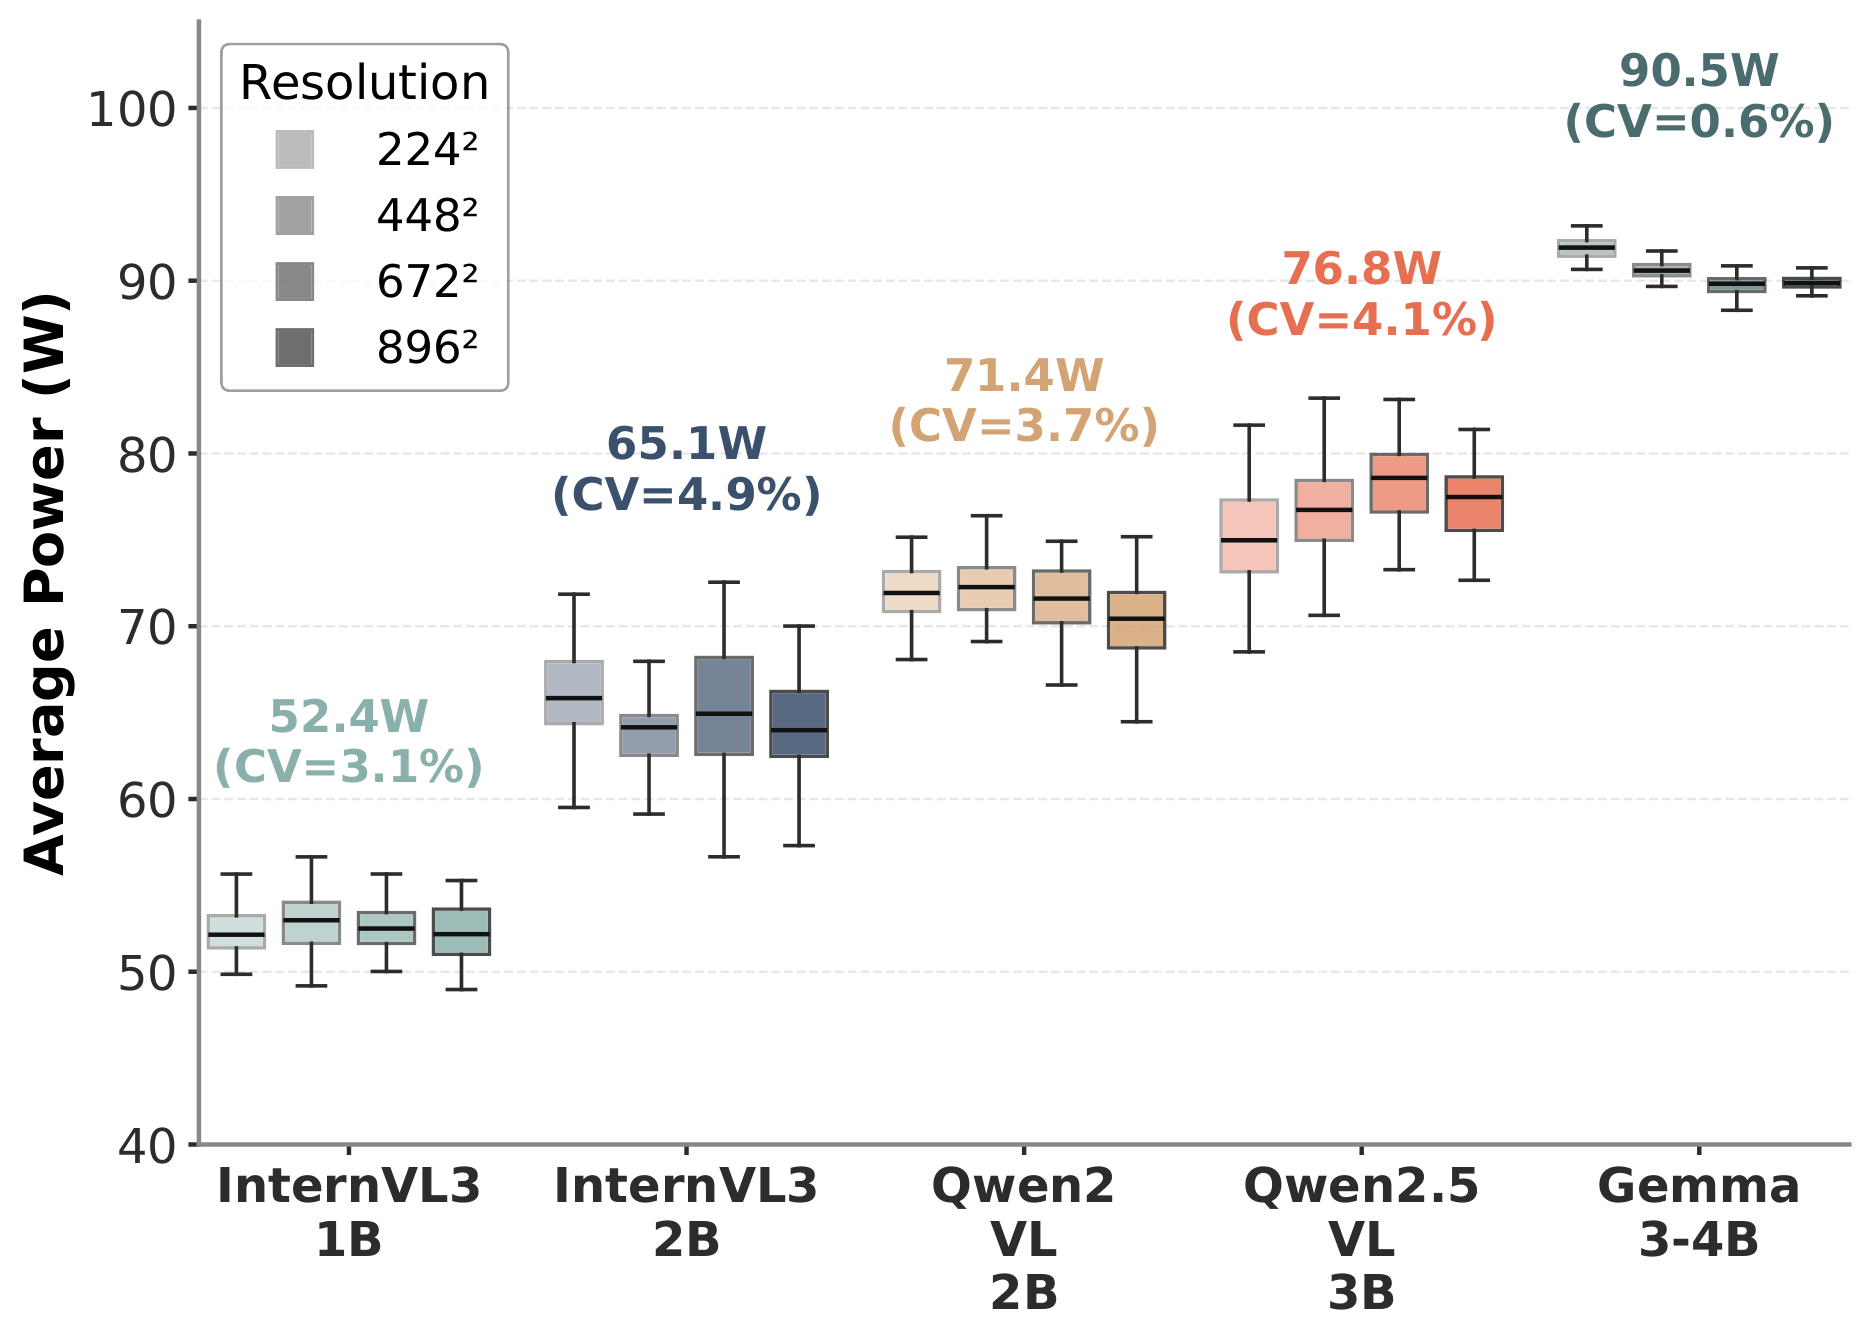
Average inference power is a model-intrinsic constant, invariant to input resolution, image complexity, and prompt type (<5% CV). This means energy analysis reduces entirely to understanding inference time.

Power vs resolution: nearly flat across 224² to 896²
(a) Power vs. resolution. Flat across 4 resolutions for all models (<5% CV).
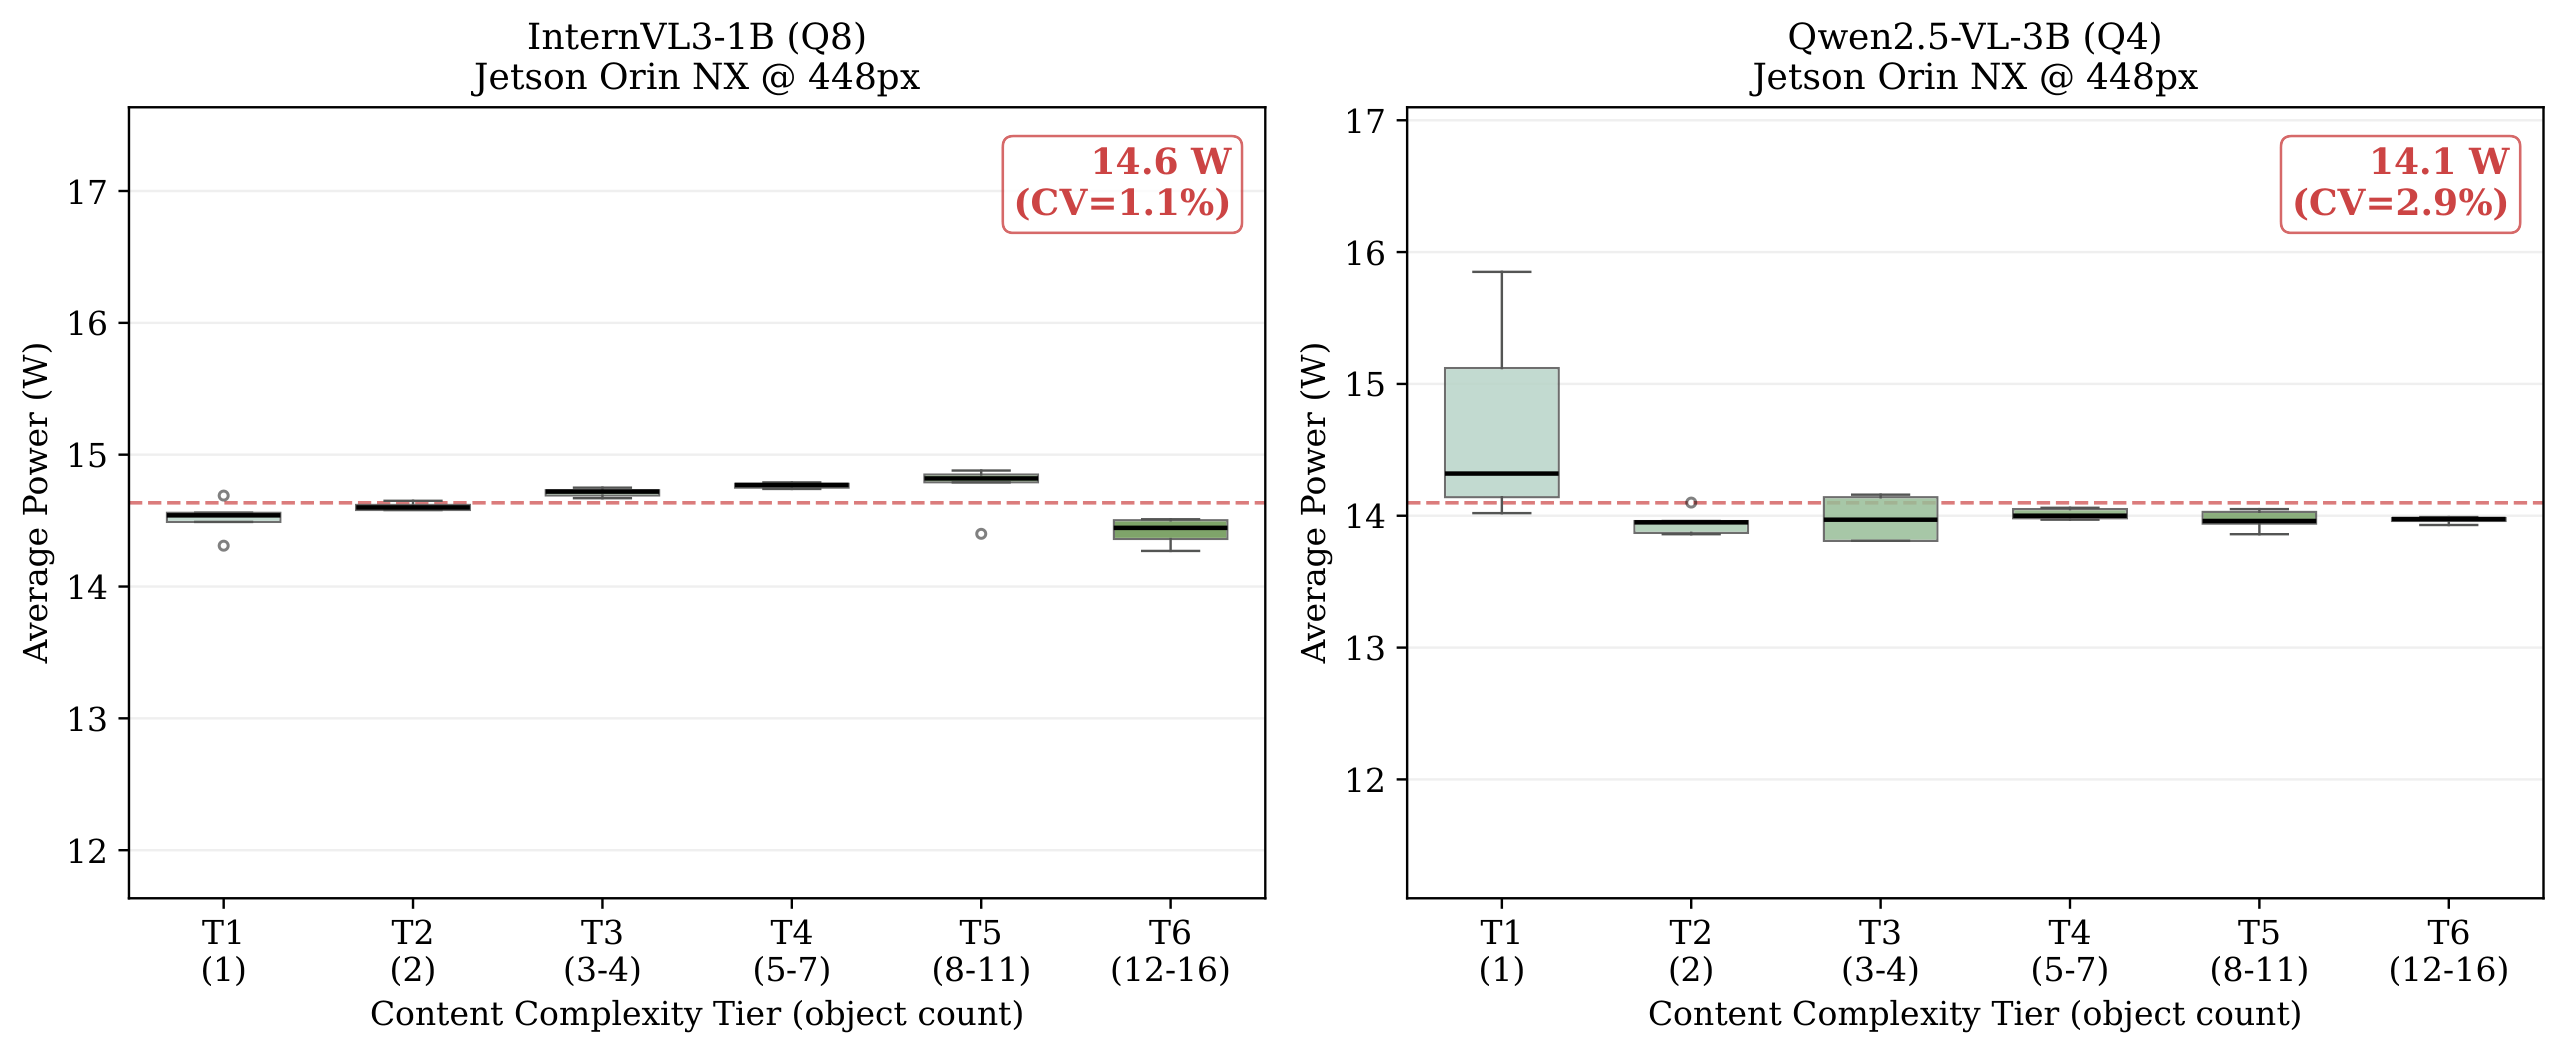
Power stability across content complexity tiers

Invariant to content complexity

From simple single-object (T1) to complex 12+ object scenes (T6), power stays flat at ~14.6W and ~14.1W.

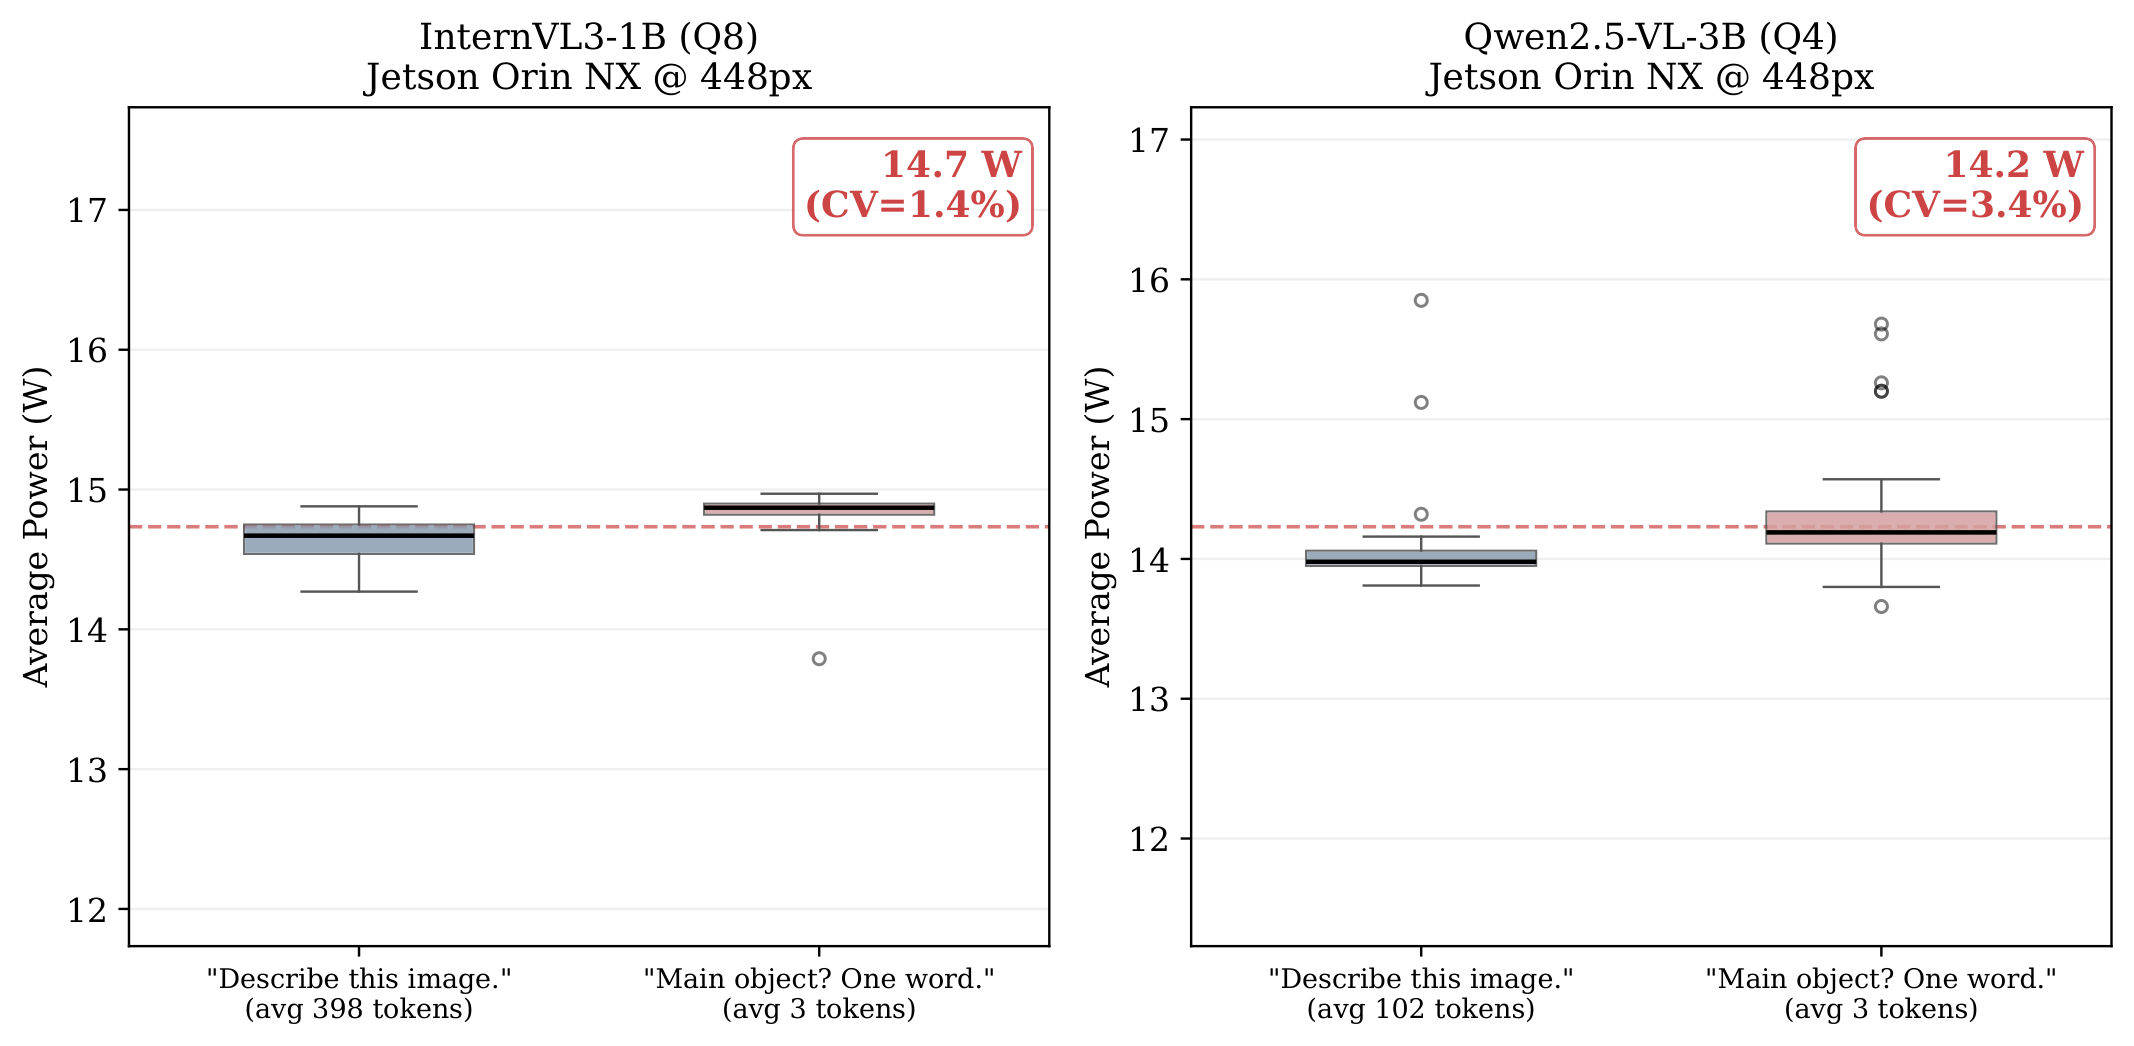
Power stability across prompt types

Invariant to prompt type

"Describe this image" (avg 398 tokens) vs. "Main object? One word" (avg 3 tokens) — same power draw, but 100× different energy.

Finding 2

Output length is the energy lever

Same model, same resolution—yet up to 4.1× energy difference between images. The cause isn't visual processing cost, but how many tokens the model generates. Reducing output from 398 to 3 tokens cuts energy by 90%.

Energy Savings Comparison

Short-answer prompt (3 tokens)↓90%
max_tokens 256→128↓45%
Remove 100% visual tokens↓≤10%
Remove 50% visual tokens↓≤5%

Formal bounds on power and pruning

We formalize our empirical findings as two propositions, providing roofline-based proofs for why power is input-invariant and why visual token pruning has a hard ceiling. (Full proofs in the Appendix.)

Proposition 1 — Power Fingerprint Under Roofline
Per-inference average power is bounded within an ε-window
Suppose that throughout an inference, the workload is at all times either compute-bound (I ≥ I*) or memory-bound (I < I*), and that the GPU is fully utilized in whichever regime it is in. Let ε = |Pmax − Pmem| / Pmax. Then:
(1 − ε) ⋅ Pmax  ≤  P  ≤  Pmax
independently of the input resolution, the image content, the prompt type, the prefill-to-decode ratio, or the number of output tokens.
Interpretation.
As long as the GPU stays saturated in whichever roofline regime applies, per-inference average power is bounded in an ε-window that does not depend on the input. On the Jetson Orin NX, ε ≲ 0.05 — exactly the <5% CV we observe empirically. The linear dependence P = 12.1S + 42.2 on parameter count S reflects Pmax itself scaling with model size, not a violation of the proposition. (See Appendix A for the full roofline-based proof.)
Proposition 2 — Energy Savings Upper Bound
Visual token pruning savings are structurally bounded by ρpre
Suppose a visual-token pruning method removes a fraction η of visual tokens, leaves the decode phase unchanged, and reduces prefill energy in proportion to the removed visual-token compute. Then the relative end-to-end energy savings satisfy:
ΔE / Etot  ≤  η ⋅ ρpre  ≤  ρpre
The bound is tight in the limit η → 1, in which case the maximum achievable saving is exactly the prefill share ρpre.
Proof sketch.
Pruning leaves decode unchanged, so E'tot = E'pre + Edec ≥ (1−η)Epre + Edec. Subtracting from Etot gives ΔE = Etot − E'tot ≤ η Epre. Dividing by Etot and substituting ρpre = Epre/Etot yields ΔE/Etot ≤ η ρpre ≤ ρpre. Setting η=1 saturates the first inequality. (See Appendix B for the complete derivation.)
Corollary 1 — Edge-Device Ceiling
Token pruning cannot exceed 10% energy savings on these configurations
For the five models profiled on the Jetson Orin NX in 15W mode, the prefill share ρpre lies between 0.05 and 0.30, depending on the model and input resolution. Therefore the end-to-end energy savings of any visual-token pruning method on these configurations cannot exceed 30%, and for most (model, resolution) pairs cannot exceed 10%.
What this rules out and what it does not.
Proposition 2 is a statement about end-to-end energy on the rail, not about FLOPs or prefill latency in isolation. It does not contradict prior work reporting 50%+ savings on those proxies — it only says those proxies do not transfer to rail-level joules on edge devices, because the decode share dwarfs the prefill share. Controlling output length attacks the 1 − ρpre portion of the budget that pruning structurally cannot touch, yielding 73–97% savings.
A universal energy predictor

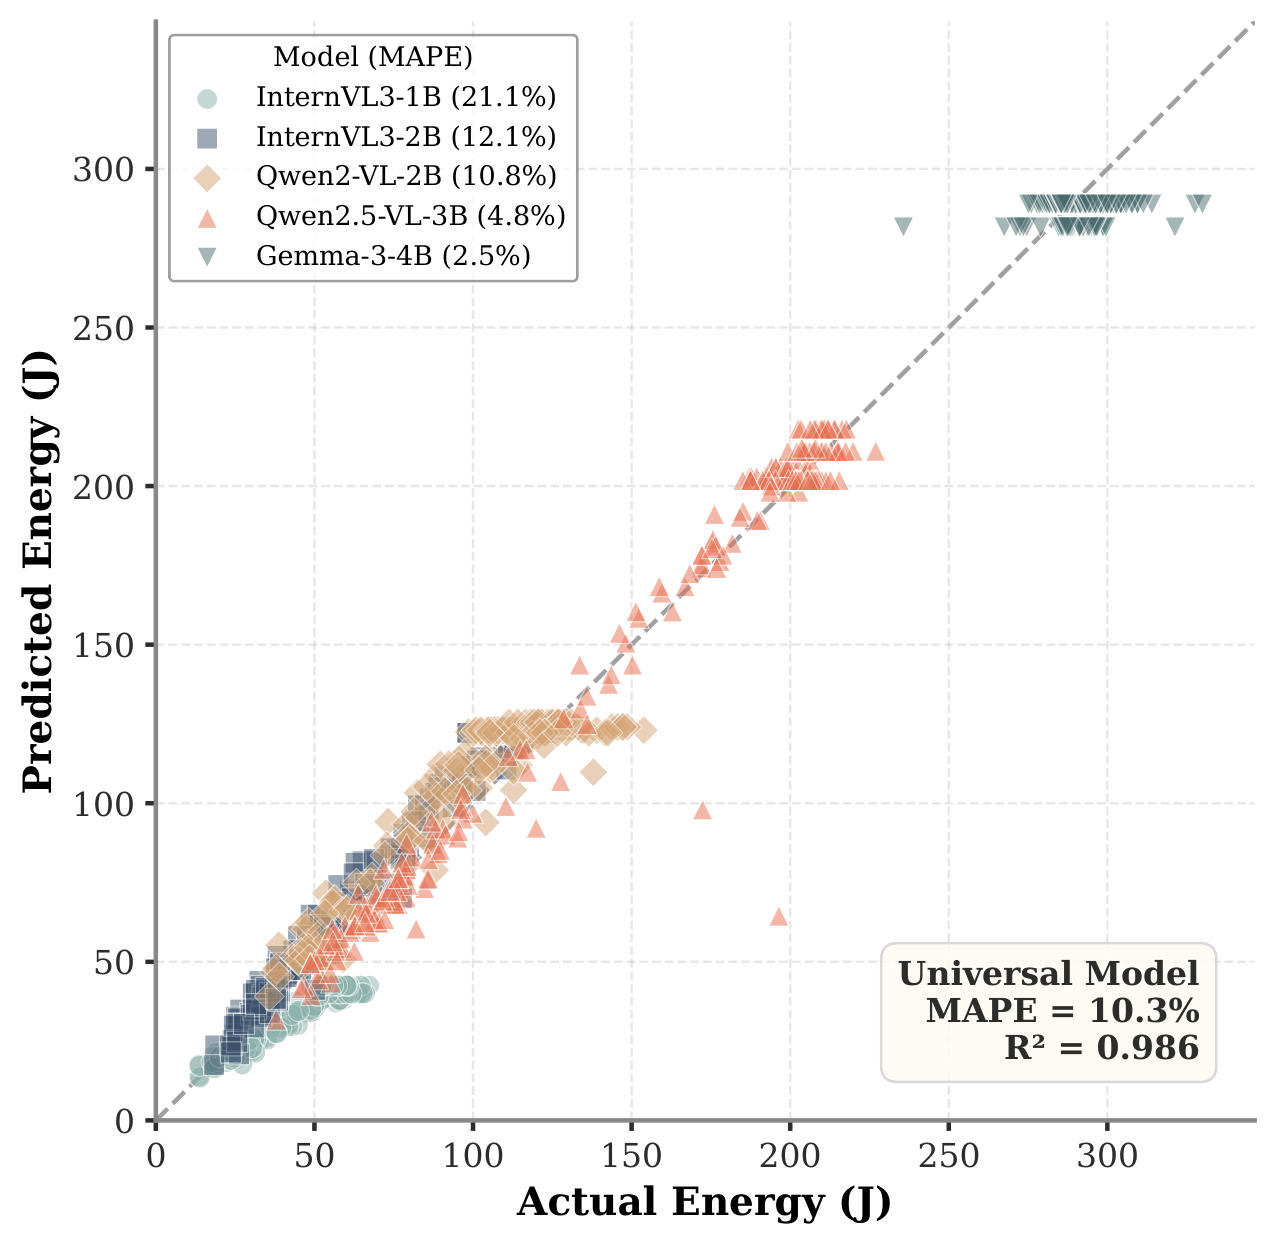
Since power is constant and time depends on token counts, we build a simple linear energy model that works across all VLMs.

EP · (αp · Nin + αd · Nout + β)
P = model power fingerprint
αp = prefill cost/token
αd = decode cost/token (11–39× more)
Nout = the dominant variable
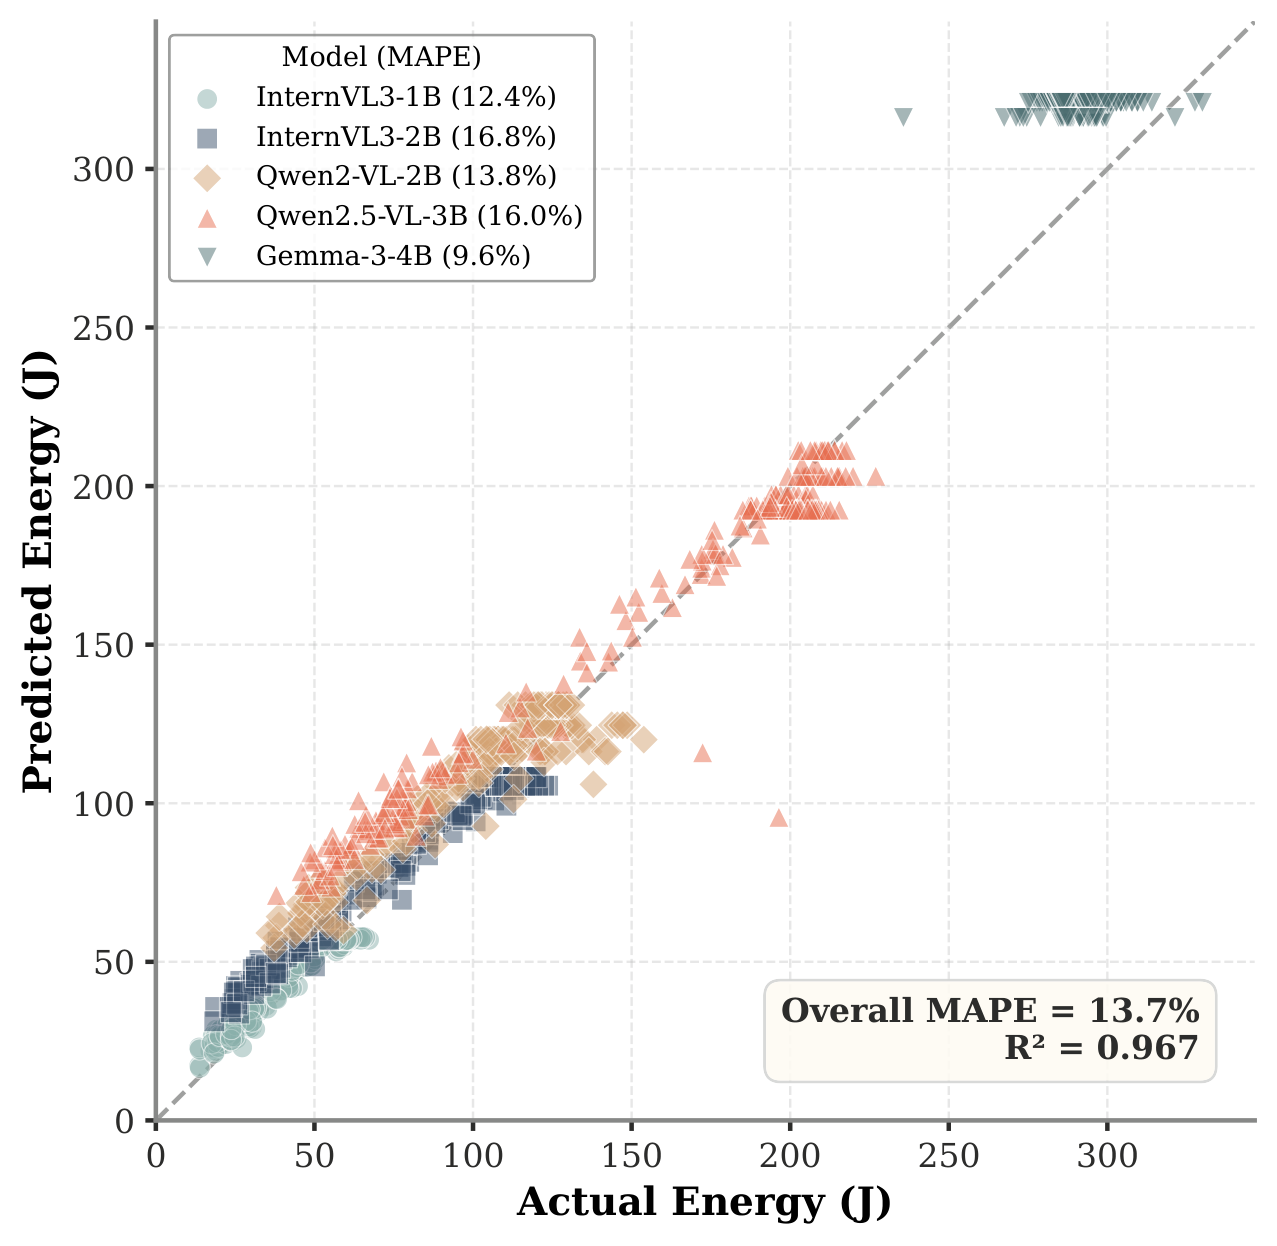
Per-model predicted vs actual energy

Per-model predictor

Parameters fitted independently per model. Overall MAPE=13.7%, R²=0.967 across 1,680 multimodal inferences.

Universal predicted vs actual energy: R²=0.986

Universal predictor

A single model across all 5 architectures: R²=0.986, MAPE=10.3%—no per-model calibration needed.

Energy calculator

Estimate inference energy on the RTX 3070 Laptop GPU using our fitted predictor. Adjust the sliders and see how output length dominates.

Estimated Energy
joules
Latency
seconds
Decode share
of total energy
Pre
Dec

Deployment guidelines for edge VLMs

Three actionable strategies derived from our energy analysis.

1

Budget output, not input

Each output token costs 11–39× more than input. Setting a lower max_tokens is the single most effective energy control. 256→128 saves ~45%.

2

Match architecture to task

If your application needs high-resolution input (e.g., fine-grained inspection), use fixed-token architectures (InternVL3, Gemma-3) to avoid the resolution-dependent energy penalty of dynamic-token models.

3

Anticipate content variation

Image content causes up to 4.1× energy variation—entirely through output length. For battery budgeting in embodied agents, use our predictor with worst-case max_tokens bounds.

Cite this work

The paper is accepted at ACM MM 2026 and will appear in the proceedings. Until the camera-ready version is online, please cite the arXiv preprint.

@misc{zhan2026seeing,
  title         = {Seeing is Free, Speaking is Not: Uncovering the True
                   Energy Bottleneck in Edge VLM Inference},
  author        = {Zhan, Junfei and Shen, Haoxun and Guo, Mingang and
                   Huang, Zixuan and He, Tengjiao},
  year          = {2026},
  eprint        = {2607.09520},
  archivePrefix = {arXiv},
  primaryClass  = {cs.CV},
  url           = {https://arxiv.org/abs/2607.09520},
  note          = {Accepted to the 34th ACM International Conference
                   on Multimedia (ACM MM 2026)}
}